Test in the discipline: “Economic analysis. Analysis of the ratio of income, expenses and financial results Ratio of profit and expenses
Ratio of income and expenses……………
| Indicators | …year | …year | |
| Excess of income from ordinary activities over expenses from ordinary activities, thousand rubles. | |||
| Ratio of income and expenses for ordinary activities, % | |||
| Excess of other income over other expenses, thousand rubles. | |||
| Ratio of other income and expenses, % |
Table 4
Composition of profit before tax……………..
| Indicators | Rel. led speakers,% |
||||||
| … year | … year | …year | …year | ||||
| Profit from sales Balance of interest received and paid Income from participation in other organizations Balance of other income and expenses | |||||||
| Profit before tax | |||||||
Table 5
Composition of financial results……………
| Indicators | Absolute value, thousand rubles. | Relates. structure value, % | Rel. led speakers,% |
||||
| … year | … year | …year | …year | ||||
| Profit from sales Balance of other income and expenses Profit before tax Deferred tax assets Deferred tax. obligationsIncome tax and other payments | |||||||
| Net income (loss) | |||||||
Table 6
Data for factor analysis of sales profit
| Indicators | Absolute value, thousand rubles. | Structure, % |
||||
| …year | …year | …year | …year | |||
| Sales revenue | ||||||
| Cost of goods sold (p., r., y.) | ||||||
| Business expenses | ||||||
| Administrative expenses | ||||||
| Revenue from sales | ||||||
NOTATION
C – selling price; K – quantity of products sold; B – sales revenue; P – profitability of sales, %; P – profit from sales; US – unit cost level in % of revenue; UKR – selling expenses in % of revenue; UUR – administrative expenses as a percentage of revenue; D - increase (decrease) due to some factor; “0” and “1” - level of the indicator in the base and reporting periods.
INFLUENCE OF CHANGES IN SALES PRICE ON CHANGES IN THE AMOUNT OF PROFIT (LOSS) FROM SALES:

Where DВts is the increase in revenue due to price changes; Uts is the price index in the reporting period compared to the base one.
The impact of changes in sales volume on the amount of profit (loss) from sales:
The impact of changes in cost on the amount of profit (loss) from sales:


The impact of changes in business expenses on the amount of profit (loss) from sales:
,The impact of changes in administrative expenses on the amount of profit (loss) from sales:
,Generalization of the influence of factors on the amount of profit (loss) from sales:
Note: when assessing the influence of factors, take into account their relationship with profit (direct or reverse effect). Direct factors (prices, sales volume) directly affect the change in profit; inverse factors (cost, commercial and administrative expenses) inversely affect profit. Accordingly, the calculated magnitude of the influence of factors of reverse action, if their share in dynamics increases, should be assessed with the opposite sign, i.e. as a decrease in the amount of profit, and a decrease in their share is assessed with a positive sign, as an increase in profit. 3. Analysis of the influence of factors on the profitability of the organization. Cost (C), commercial (CR) and management (UR) expenses are taken in monetary terms.Return on sales
Impact of changes in revenue
Impact of cost changes
Impact of changes in business expenses
Impact of changes in management expenses
Generalization of the influence of factors on profitability of sales:
In addition to return on sales, to characterize business efficiency, return on investment indicators (investments of fixed assets, equity and attracted capital, etc.) should be calculated and analyzed. Table 7 presents 2 groups of profitability indicators: indicators of return on sales and return on investment.
Table 7
Analysis of profitability of financial and economic activities
| Indicators | … year | … year | Off, +,- |
| 1. Amount of profit (loss), thousand rubles: - from sales - before taxation - net | |||
| 2. Income from financial investments, thousand rubles. | |||
| 3. Profitability, %: - core activities - sales - fixed assets - financial investments - equity capital - attracted capital - property (capital) |
Table 8
Calculation of fixed and variable costs for products sold
| Cost elements | ||||
| Fixed costs | Variable costs | Fixed costs | Variable costs |
|
| 1. Material costs2. Remuneration3. Contributions for social needs4. Depreciation5. Others | ||||
| Total | ||||
| Adjusted costs* | ||||
Table 9
Operating leverage analysis…………….
| Indicators | .... G. | .... G. | Off, % |
1. Sales revenue, thousand rubles.2. Variable costs, thousand rubles.3. Conditionally fixed costs, thousand rubles.4. Gross profit, thousand rubles.5. Profit from sales, thousand rubles.6. Gross margin, thousand rubles. (item 1-item 2)7. Operating profitability, % (item 5: item 1)8. Break-even point, thousand rubles. (clause 3: (clause 6: clause 1))9. Margin of financial strength: 9.1. thousand roubles. (clause 1 – clause 8.) 9.2. %  10. Operating leverage level: 10.1. clause 3: clause 2 10.2*. TS according to clause 5: TS according to clause 1 10.3. p.6: p.5 10. Operating leverage level: 10.1. clause 3: clause 2 10.2*. TS according to clause 5: TS according to clause 1 10.3. p.6: p.5 |
Conclusion:
Autonomy coefficient - shows the share of the organization’s assets that is covered by equity capital, i.e. is provided by its own sources, and the remaining share of assets is formed from earthly funds. The higher the value of this coefficient, the more financially stable, stable and independent the organization is from external creditors. The data in Table 3 shows the actual increase in the standard value of the autonomy coefficient: at the end of the reporting year the coefficient was 0.5202.
Financial stability ratio - shows the share of those sources of financing that the organization can use in its activities for a long time. The financial stability ratio shows the proportion of a company's assets financed by its own capital. In the previous and reporting year, the financial stability coefficient was greater than the optimal value of 0.7825 and 0.8317, respectively, i.e. the enterprise may well be financed from its own sources.
Financial leverage - characterizes the degree of risk of invested financial resources. Shows how much borrowed capital is per 1 ruble. own capital. In the previous year, the coefficient was within the normal range and amounted to 1.0822 - this indicates that the company has a lot of loans, it is in a risky situation, which can lead to bankruptcy. Also, a high ratio from the previous year shows that the company has a cash shortage. In the reporting year, the coefficient does not exceed the optimal value of 0.9224, i.e. in the reporting year, loans decreased and no longer exceed equity capital; this undoubtedly indicates a favorable situation at the enterprise.
Maneuverability coefficient – shows the ability of the enterprise to maintain the level of its own working capital and replenish working capital, if necessary, from its own sources. This coefficient decreased by 0.0561 compared to the beginning of the year and amounted to 0.0223 by the end of the year, which does not correspond to the standard value (³ 0.2 ¸ 0.5). The agility coefficient of this organization shows negative dynamics.
Permanent asset index reflects the ratio of non-current assets (together with long-term receivables) and net assets. A stable index value indicates that the growth rates of permanent assets and net assets are at the same level. In the previous and reporting year, this index does not exceed the optimal value< 1 , this indicates the good condition of the enterprise. In the reporting year, this index increased by 0.0561, which leads to a less favorable situation at the enterprise. But still, according to this indicator, the financial stability of the organization is assessed satisfactorily.
Current assets coverage ratio with own assets means- determines the degree of security organizations own working capital necessary for its financial stability. Neither the previous year nor the reporting year is within the optimal value (≥1), this indicates that the organization does not have its own funds to cover the entire need for current assets.
From the calculations for assessing the dynamics of the organization's financial stability indicators, it is clear that in the previous year the financial condition was unstable, this could lead to bankruptcy. A large number of loans, an increase in accounts payable - a sign of increasing potential insolvency and instability of the development of the enterprise is reflected in the financial condition of the organization. The organization cannot pay off debts from its own funds, which leads to the accumulation of debts. In the reporting year, the financial condition of the organization improved, some ratios became more optimal, but have not yet reached such a level that we can firmly speak about the stability of the financial condition and sustainability of the enterprise. (The financial stability coefficient increased by 0.0492.) Some indicators, on the contrary, worsened. The company does not have sufficient capital flexibility. The growth rates of permanent assets and net assets are not at the same level. Knowledge of the standard values for the use of own and borrowed funds to cover investments in current and non-current assets makes it possible to find opportunities to strengthen the solvency and financial stability of an organization in the market system, and to create conditions for preventing “financial shocks”.
Task 3
Based on the profit and loss report (Appendix 2), analyze the composition, structure and dynamics of the organization’s income and expenses. Calculate the ratio of the organization's income and expenses. Present the calculation results in Table 4.
Table 4
Structural-dynamic analysis of income and expenses of an organization
| Index | Reporting year | Last year | Change | |||
| thousand roubles. | % | thousand roubles. | % | thousand roubles. | % | |
| 1. Income of the organization - total, including: | 7 704 150 | 100 | 7 391 300 | 100 | 312 850 | - |
| 1.1. | 6 811 655 | 88,42 | 6 432 620 | 87,03 | 379 035 | 1,39 |
| Revenue (net) from the sale of goods, works, services | 364 166 | 4,73 | 485 630 | 6,57 | -121 464 | -1,84 |
| 1.2. | 528 329 | 6,86 | 473 050 | 6,40 | 55 279 | 0,46 |
| Interest receivable | 7 343 135 | 100 | 7 105 378 | 100 | 237 757 | - |
| 1.3. | 6 097 352 | 83,03 | 5 817 260 | 81,87 | 280 092 | 1,16 |
| Other income | 122 580 | 1,67 | 114 642 | 1,61 | 7 938 | 0,06 |
| 2. Expenses - total, including: | 320 940 | 4,37 | 384 110 | 5,41 | -63 170 | -1,04 |
| 2.1. | 184 296 | 2,51 | 101 232 | 1,42 | 83 064 | 1,09 |
| Cost of goods, works, services sold | 527 714 | 7,19 | 616 654 | 8,68 | -88 940 | -1,49 |
| 2.2. | 90 253 | 1,23 | 71 480 | 1,01 | 18 773 | 0,22 |
| Business expenses | 1,0492 | 1,0402 | 0,0089 | |||
2.3.
Income (expense) indicators for the reporting and previous year in % are defined as the ratio of each income (expense) indicator for the reporting and previous year of the organization to the entire amount of income (expenses) for the reporting and previous year, multiplied by 100%:
The change is calculated as the difference between the indicators for the reporting year and the indicators for the previous year.
Conclusion:
Looking at this table, it is clear that the organization's income exceeds its expenses, which means that the organization makes a profit as a result of its activities.
Comparing the total income of the organization for the reporting year and the previous year, we can talk about an increase in the total amount of income in the reporting year compared to the previous year by 312,850 thousand rubles. This increase was influenced by changes in the volume of revenues and the share of each item of income of the organization.
Analyzing the composition of the organization’s income, we can say that the first place in terms of the volume of income received is occupied by revenue (net) from the sale of products, works, and services. It makes up a large share of the organization's total revenue. The volume of its revenues in the reporting year amounted to 6,811,655 thousand rubles, and in the previous year – 6,432,620 thousand rubles. In the reporting year, the share of revenue (net) from the sale of goods, works, and services accounts for 88.42% of all receipts, although in the previous year this share was 87.03%. As we can see, over the year there was an increase in volumes (by 379,035 thousand rubles) and the share of revenue (by 1.39%) in the organization’s income. This could be influenced by such factors as: an increase in production volumes, a decrease in production costs, changes in the price level, etc. revenue, it is necessary to use analytical accounting data.
The second largest income according to the reporting and previous year data is other income. Their volume of receipts is significantly lower than receipts from revenue, and amounted to 528,329 thousand rubles in the reporting year, and 473,050 thousand rubles in the previous year. Other income, as well as revenue (net) from the sale of products, works, and services in the reporting year (compared to the previous one) increased by 55,279 thousand rubles. The share of other income in the total income received by the organization in the reporting year accounts for 6.86%, and in the previous year this share was 6.40%. As you can see, the value of other income in the reporting year increased by 0.46%.
The rest of the organization's income comes from interest receivable. Their revenue volume in the reporting year is lower than in the previous year and amounts to 364,166 thousand rubles, and in the previous year – 485,630 thousand rubles. The decrease in interest receivable in the reporting year in absolute terms amounts to 121,464 thousand rubles. The share of this part of income in the reporting year accounts for 4.73%, and in the previous year this share was 6.57%. Analyzing both years, we can say that in the reporting year, compared to the previous year, there was a decrease in both the volume of revenue and the share of this part of income. The value of the “interest receivable” income line in the reporting year decreased by 1.84%.
Comparing the total expenses of the organization for the reporting year and the previous year, we can talk about an increase in the total amount of expenses in the reporting year compared to the previous one by 237,757 thousand rubles. This increase was influenced by changes in the volume of expenses and the share of each expense item in the total expenses of the organization.
Analyzing the composition of an organization’s expenses, we can say that the first place in terms of costs is occupied by the cost of goods, products, works, and services sold. It constitutes a large share of expenses in all expenses of the organization. The volume of expenses for this expense item in the reporting year amounted to 6,097,352 thousand rubles, and in the previous year – 5,817,260 thousand rubles. In the reporting year, the cost of goods, works, and services sold accounted for 83.03% of all costs, although in the previous year this share was 81.87%. As we can see, over the year there was an increase in volumes (by 280,092 thousand rubles) and the share of costs for production costs (by 1.16%) in the organization’s expenses.
The next largest expenses according to the reporting and previous year are other expenses. In absolute terms, they are significantly lower than the cost of production costs, and in the reporting year amount to 527,714 thousand rubles, and 616,654 thousand rubles. in the previous one. Other expenses in the reporting year decreased by RUB 88,940 thousand compared to the previous year. The share of other expenses in the total of all expenses of the organization accounts for 7.19% in the reporting year, and in the previous year this share was 8.68%. As you can see, the value of commercial expenses in the reporting year decreased by 1.49%.
Administrative expenses, although not significantly, are inferior in volume to other expenses. In the reporting year, the volume of management costs amounted to 320,940 thousand rubles. In the previous year, these expenses amounted to 384,110 thousand rubles. As you can see, over the year there was a decrease in this expense item by 63,170 thousand rubles. The share of administrative expenses in the total expenses of the organization in the reporting year decreased by 1.04% compared to the previous year. In the reporting year, they account for 4.37% of all expenses, and in the previous year their share was 5.41%.
Also included in the organization's expenses are interest payable, which in the reporting year amounted to 184,296 thousand rubles, and in the previous year 101,232 thousand rubles. The increase in this expense item is 83,064 thousand rubles. The share of this cost item in the total amount of expenses increased by 1.09%. In the reporting year, the share of other expenses was 2.51%, and in the previous year it was 1.42%.
Commercial expenses of the organization also occupy an important place in the expenses of the enterprise. The share of this cost item in the reporting year was 1.67%, which in absolute terms corresponds to the amount of expenses in the amount of 122,580 thousand rubles, and in the previous year the share of expenses was 1.61%, which corresponds to 114,642 thousand rubles. costs. The reduction in the share of commercial expenses is determined at 0.06%. In absolute terms, the decrease in this share is 7,938 thousand rubles.
The rest of the organization's expenses is income tax. Its volume in the reporting year is higher than in the previous year and amounts to 90,253 thousand rubles, and in the previous year it was 71,480 thousand rubles. The increase in income tax in the reporting year in absolute terms is 18,773 thousand rubles. The share of this part of expenses in the reporting year accounts for 1.23%, and in the previous year this share was 1.01%. Analyzing both years, we can say that in the reporting year, compared to the previous year, there was an increase in both the volume of expenses and the share of this part of expenses. The value of the income tax expense line in the reporting year increased by 0.22%.
In order to identify the reasons for the decrease in expense items, it is necessary to use analytical accounting data and, after analyzing this accounting, draw appropriate conclusions.
When performing the calculation of this task, it is necessary to calculate the ratio of income and expenses, which is found as the quotient of dividing income by expenses. For the previous year, the value of this coefficient is: 7,391,300 / 7,105,378 = 1.0402, and for the reporting year this coefficient is: 7,704,150 / 7,343,135 = 1.0492. The value of this coefficient in the reporting year increased by 0.0089 compared to the previous year. This, undoubtedly, positively characterizes the state of the organization. This ratio shows how many times income exceeds expenses.
Task 4
Based on the financial statements (Appendices 1, 2), examine the level and dynamics of the profitability of the organization’s assets, taking into account the factors that determine it. Present the calculation results in Table 5. List of references……………………………………………………………….…..36
Determination of the financial stability of the insurer,
Involved in property insurance.
Target - determine insurance rates and indicators characterizing the financial stability of the insurer, draw conclusions.
Insurance tariff (tariff rate)– this is the rate of insurance premium per unit of sum insured or object of insurance. It is determined in absolute monetary terms, as a percentage or per mille in a predetermined time interval (insurance period). When constructing tariffs for property insurance, the tariff rate is a fee in kopecks per 100 rubles. insurance amount per year. Insurance rates for compulsory insurance are established in accordance with federal laws on specific types of compulsory insurance. Voluntary insurance is calculated by insurers. The specific amount is determined by the voluntary insurance contract by agreement of the parties.
There are two types of tariff rates: net rate and gross rate.
Net rate forms the basis of the insurance tariff. Intended exclusively for the formation of an insurance fund. In terms of its economic content, it is the price of insurance risk. Its value should guarantee the formation of an insurance fund sufficient to pay insurance amounts.
Risk premium– part of the net rate intended to cover possible deviations in the loss ratio of the insurance amount from its average (expected) purpose. Necessary in case of payment of insurance compensation exceeding the average level. The amount of the premium depends on the specified level of security guarantee and the standard deviation of the amount of payments (damages).
Gross rate– this is the rate at which the insurance contract is concluded. Consists of two parts: net rate and load.
– expenses and profits of insurance organizations (for conducting business related to the organization of insurance, for paying for the services of an insurance intermediary, insurance agents or brokers, the expected rate of profit from insurance and other expenses).One of the main elements of insurance that determines the amount of payments upon the occurrence of an insured event is the insured amount.
Sum insured – the amount of money for which property (in property insurance), life, health, and ability to work (in personal insurance) are actually insured.
Insurance payments are calculated based on the insured amount at current rates. In property insurance, the insured amount should not exceed the value of the insured object. For compulsory property insurance, the insured amounts are determined by law in a single amount (percentage) of the cost of the relevant property. The established insurance amounts for voluntary insurance serve as the maximum limit; the owner of the property can insure it for smaller amounts. Sometimes voluntary insurance provides for the minimum possible insurance amounts for insuring the property of cooperative and public organizations.
Loss of the insured amount – an indicator expressing in rubles and kopecks the ratio of the total amount of insurance compensation on the scale of a region or country as a whole to the number of hundreds of the corresponding insured amount of all insured objects. It is a mathematical expression of insurance risk as the probability of damage, which forms the basis of net tariff rates.
To construct net rates for all types of insurance, except life insurance, the average loss ratio of the insured amount for the tariff period, which covers 5 or 10 years of this insurance, is used. Indicators of loss ratio of the insured amount are analyzed annually to determine their compliance with current net rates in order to monitor the financial stability of insurance operations. The loss ratio of the insured amount is formed under the influence of various factors: the number of insured objects and their insured amount, the number of insured events, the number of damaged objects, the amount of insurance compensation. Determined for each type of liability or generally for the type of insurance.
The methodology for calculating net rates for each type or homogeneous insurance objects comes down to rounding the average loss ratio of the insured amount for the tariff period, that is, for 5 or 10 years, adjusted for the value of the risk premium. To do this, first of all, a dynamic series of indicators of the loss ratio of the insured amount is constructed and its stability is assessed, depending on which the issue of the size of the risk premium is decided.
Under financial stability of insurance operations refers to the constant balancing or excess of income over expenses in the insurance fund. The problem of ensuring financial stability can be considered in two ways.
How is the ratio of income and expenses.
In this case, the indicator of financial stability is defined as the ratio of income to expenses for the expired tariff period:
Where KFU– financial stability coefficient;
D– the amount of income of the insurer for the tariff period;
Z– the amount of funds in reserve funds;
R– the amount of expenses for the tariff period.
Financial stability ratio shows how many rubles of income and reserve funds are per ruble of expenses in a certain year.
The value of the financial stability coefficient should be considered normal when it exceeds one, i.e. when the amount of income for the tariff period, taking into account the balance of funds in reserve funds, exceeds all expenses of the insurer for the same period. From the definition formula KFU It can be seen that in order for income to exceed expenses for a tariff period based on optimal tariffs, it is necessary to have a sufficient concentration of insurance fund funds and the presence of a system of reserve funds, which make it possible to compensate for extraordinary damage in unfavorable years, and thereby ensure the distribution of damage over time.
The ratio of all income and expenses is determined by the formula:
KS = (sum of lines 010,060,080,090,120 of form No. 2)/(sum of lines 020,030,040,070,100,130,150 of form No. 2)
| No. | Name | 2000 | 1999 | change |
| 1 | sum of all income | 34900 | 33520 | 1380 |
| 2 | sum of all expenses | 34290 | 30050 | 4240 |
| 3 | KS income and expenses | 1,018 | 1,115 | -0,098 |
As we can see from the table, the ratio of income to expenses in 2000 decreased compared to 1999 by 0.098 percentage points. This was due to rising costs.
Net current assets characterize that part of their volume that is formed at the expense of own and long-term borrowed capital. The formula for net working capital is presented as:
NOA = OA - KFO, where
NOA - the amount of net current assets of the organization;
OA - the amount of gross current assets of the organization;
KFO - short-term current financial obligations of the organization.
Let's present the data in table form.
| No. | Name | 2000 | 1999 | change |
| Gross current assets | 5630 | 6350 | -720 | |
| Short-term liabilities | 6500 | 2900 | 3600 | |
| CHOA | -870 | 3450 | -4320 |
The value of net current assets in 2000 turned out to be negative. This is caused by an increase in the organization's short-term liabilities.
At the end of the analysis of income and expenses, a ratio analysis should be performed. The analysis will be considered complete only after research and description of the calculated coefficients over time.
Table 4. Ratio analysis of income and expenses
|
Index |
||||
|
Interest income |
||||
|
Interest expenses |
||||
|
Total income |
||||
|
Total expenses |
||||
|
Payroll + other costs for maintaining the management staff |
||||
|
Operating income |
||||
|
Operating expenses |
||||
|
Net profit |
||||
|
Equity |
||||
|
Ratio of interest income and interest expenses |
Interest income/Process expense |
|||
|
Cost effectiveness ratio |
Total income/Total expenses |
|||
|
The coefficient of use of income for the maintenance of the management apparatus |
(payroll + other costs of maintaining the management staff)/Total income |
|||
|
Operational efficiency |
Operating expenses/Operating income |
|||
|
Overall profitability (return on costs) |
Profit/Total Expenses |
|||
|
Return on equity |
The calculation of the coefficients allows us to draw the following conclusions:
The interest income-to-expense ratio evaluates a bank's ability to generate profit from risk-related activities. The higher this indicator, the better. The dynamics of the indicator are positive, which indicates that interest income is growing faster than interest expenses are increasing.
The cost efficiency ratio evaluates the efficiency of the bank as a whole and its ability to cover overhead costs. This indicator also has an undefined trend, but throughout the entire period under review it exceeds 1, which indicates the efficiency of the bank as a whole and its ability to cover overhead costs.
The coefficient of use of income for the maintenance of the management apparatus reflects the relative efficiency of the bank's costs for the maintenance of the apparatus. This indicator can be assessed as a criterion for material incentives for employees. The increase indicates the bank's interest in material incentives for staff.
Operating efficiency characterizes the level of coverage of operating expenses by corresponding income. The values indicate that operating expenses are not fully covered by operating income.
Return on costs shows how much profit the bank makes from each ruble invested. A decrease indicates a decrease in the share of profit.
Return on equity is calculated by dividing net income (usually for the year) by equity. The higher the return on equity, the better.
Read also...
- Analysis of the ratio of income, expenses and financial results Ratio of profit and expenses
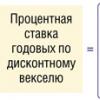
- How to calculate interest (discount) on a bill received
- Czech cuisine. We translate the Czech menu. Traditional Czech dishes Czech cooking
- Classic onion salad with boiled egg and mayonnaise How to make onion salad
